Adding a Company Summary to a Dashboard
To add the Company Summary you are viewing to one of your personal dashboard displays, click the add (![]() ) icon at the top of the screen.
) icon at the top of the screen.
![]()
Last Trade:
To access the full stock quote detail of the company you are viewing, click anywhere in the Last Trade row.
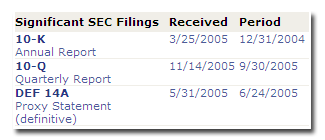
Significant SEC Filings:
You can access the company's latest significant filings, including the latest annual report, quarterly report and proxy statement, by clicking the form that interests you.
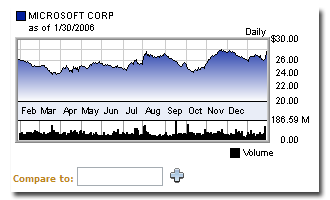
1 Year Historical Chart:
The historical chart provides an instant visual gauge of the companies trading activity for the last year. You can quickly add an additional ticker symbol for comparison, or click the chart directly to access additional charting options.
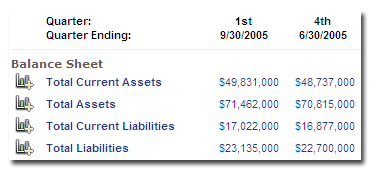
Financials
The financials summary display provides top line Balance Sheet, Income Statement and Cash Flow data for the last 5 quarters. For visual analysis, click on the chart (![]() ) icon to display the row of data. To drill down into the expanded financials, click on any row of data.
) icon to display the row of data. To drill down into the expanded financials, click on any row of data.
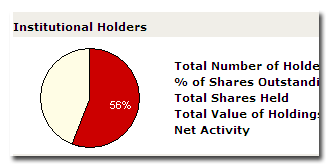
Ownership
Drill down from summary Institutional Holders, Insider Holdings and Insider Proposed Sales to access underlying data by clicking anywhere in the row.
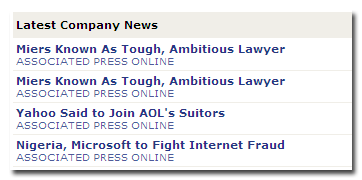
Company News
Click a headline to access the full text of a company news article from sources such as PR Newswire, Business Wire, Associated Press, Knight Ridder and others.
View Related Help Topics
• Adding Content to a Dashboard
• Last Trade
• Historical Charting
• Balance Sheet
• Cash Flow
• Income Statement
• Company News