To add an Intraday Chart to one of your personal dashboard displays, click the add (
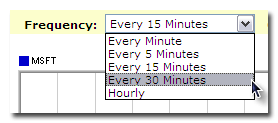
Changing Frequency
Intraday Charts display in one minute intervals by default. You can change the frequency to display:
• Every 5 Minutes
• Every 15 Minutes
• Every 30 Minutes
• Hourly

Performing Comparisons
To compare the current company with an additional company, simply enter the ticker symbol in the "Compare to Ticker" field and click the add (![]() ) icon.
) icon.

Switching Intraday Charting Views
By default, Intraday Charts display in a Mountain View style. Switch to a Straight Line view by clicking the link displayed underneath the chart.
![]()