Income Statement data is prepared by EDGAR Online using a proprietary standardized industrial company format. When extracting data from SEC filings, EDGAR Online reserves the right to reclassify line items and regroup amounts to meet their specifications. Therefore, it is possible that the EDGAR Online Financials displayed will not have a one-for-one mapping of line items and amounts. This standard format allows for direct comparison of all companies, industries and indexes, across multiple time frames and for a multitude of factors.
Viewing Income Statement Data
By default, quarterly income statement data is displayed, and values expressed in (000's). Switch to Annual Income Statement data by selecting the 'Annual Income Statement' link displayed above the data. Switch to Trailing Twelve Month Income Statement data by selecting the 'Trailing Twelve Months' link displayed above the data.

Switch back to Quarterly Income Statement data by selected the 'Quarterly Income Statement' link displayed on the Income Statement data view.
Income Statement Data Verification
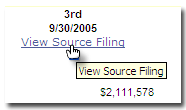
Under each Quarter or Annual data column, select the 'View Source Filing' link to be taken directly to the corresponding SEC Filing section.

Exporting Income Statement Data to Excel
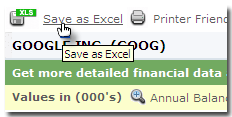
To export the Income Statement data you are currently viewing to Excel, select the 'Save as Excel' link.

Charting Income Statement Data
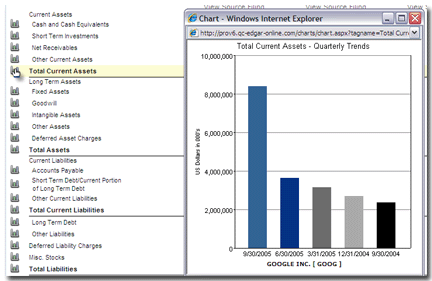
You can quickly and easily chart any row of Income Statement Data by selecting the (![]() ) icon next to each data row.
) icon next to each data row.
